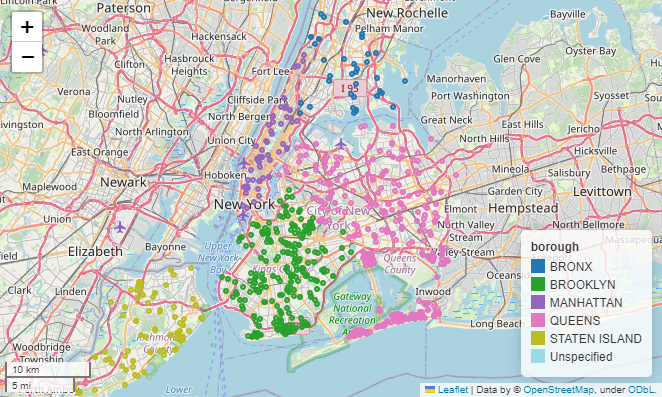
NYC 311 Complaints vs Storm Water Flooding by Neighborhood Tabulation Areas (NTAs)#
Author: Ho Hsieh LinkedIn GitHub
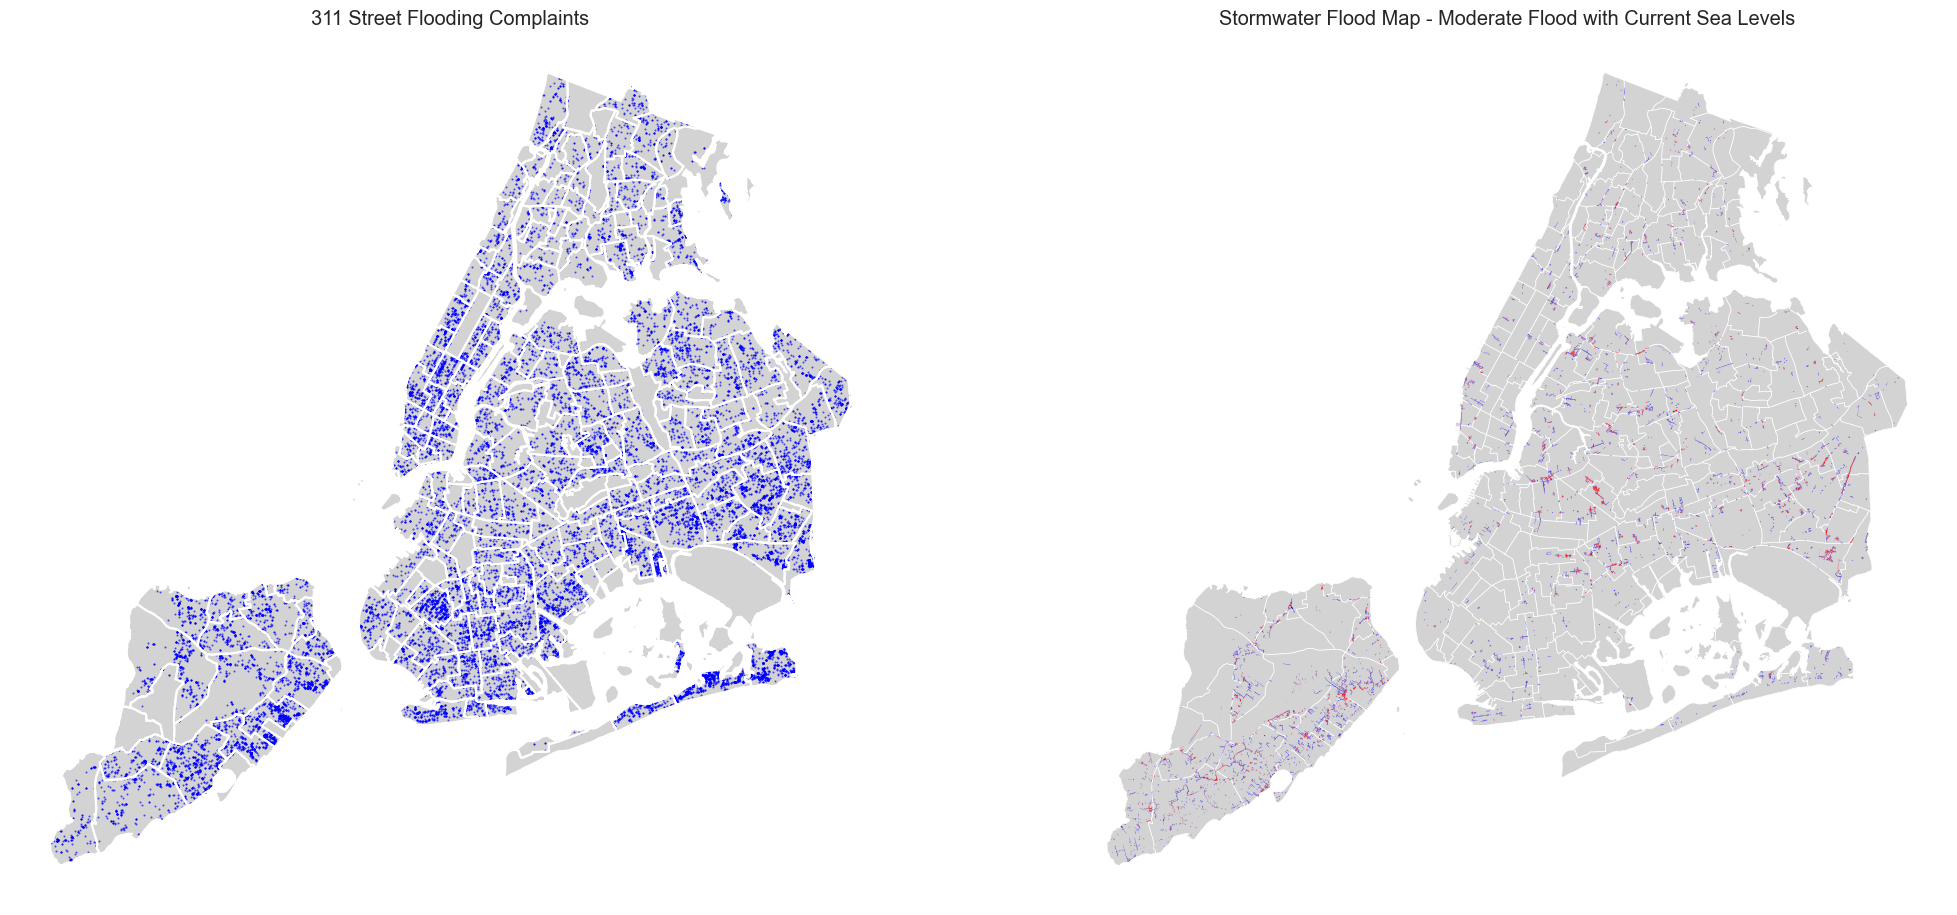
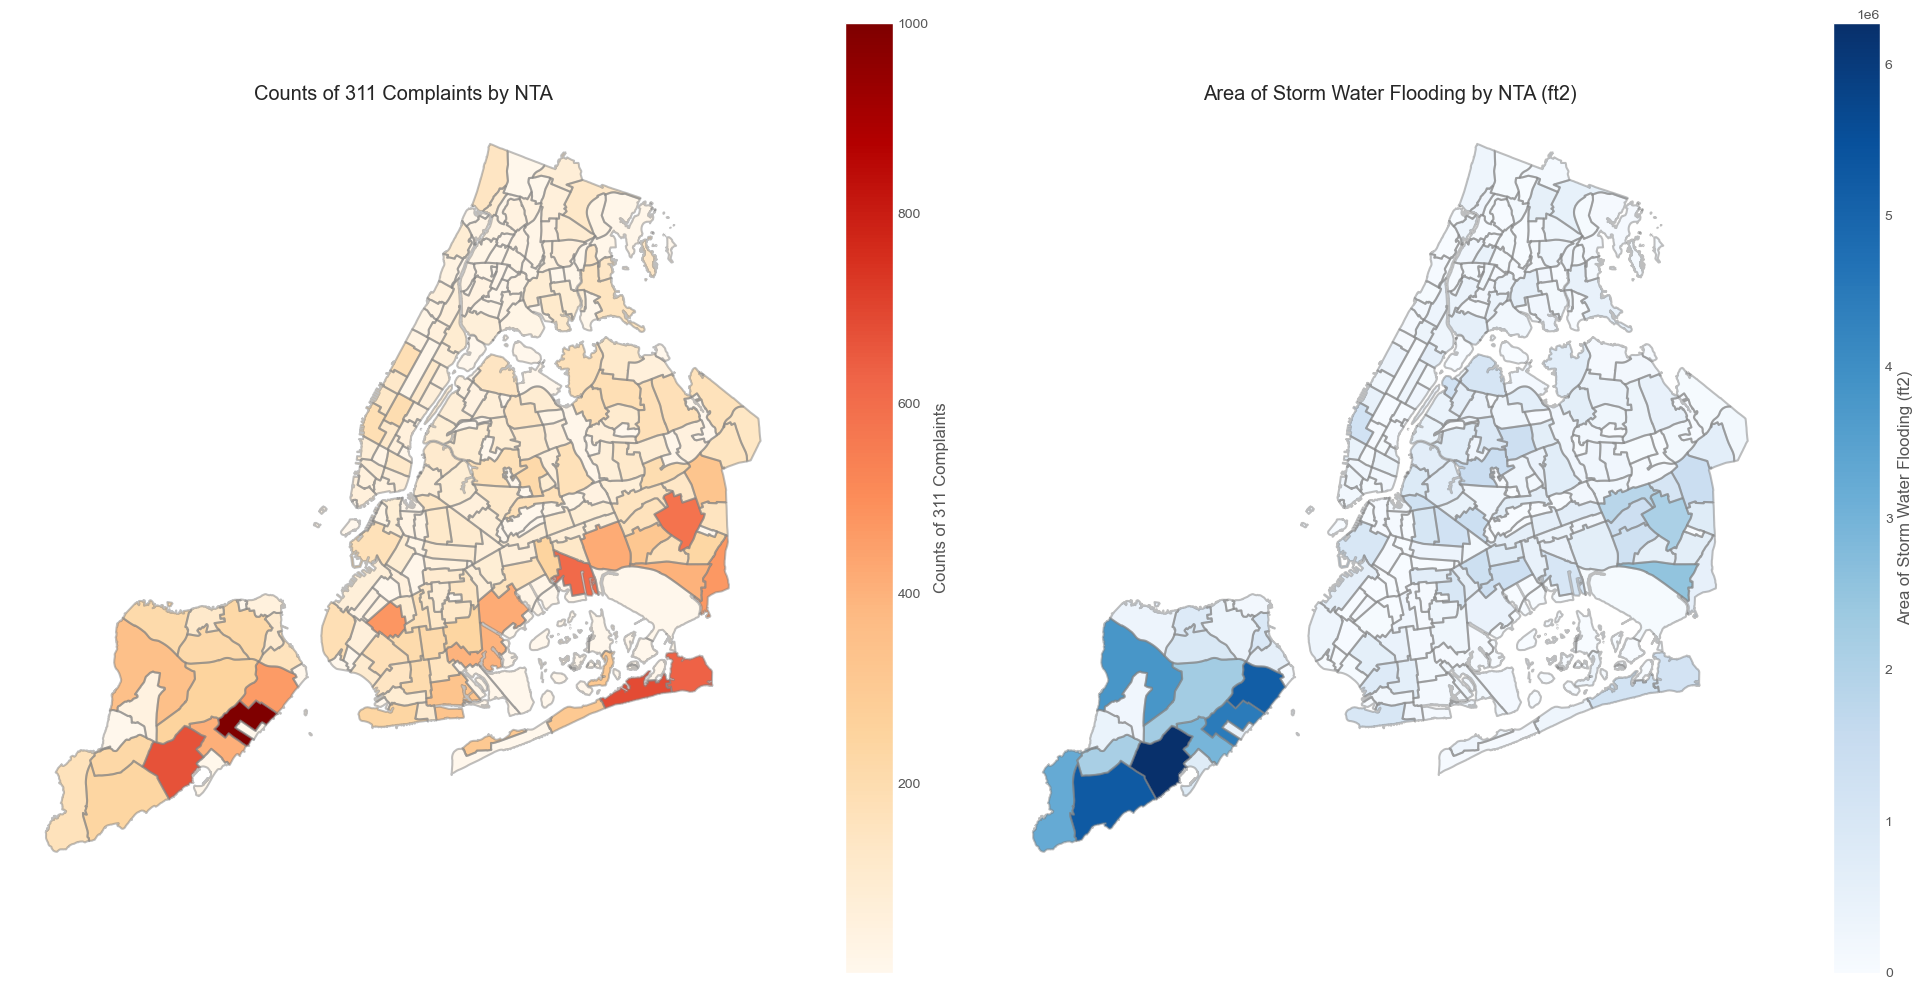
In this study, we want to examine if the counts of NYC 311 street flood complaints can be explained by flood area within the Neighborhood Tabulation Areas (NTAs).
The 311 flood complaints data are prepared from a previous project and can be accessed at here
The flood data used here are the modeled New York City Stormwater Flood Maps (Moderate Stormwater Flood with Current Sea Level Rise) here
The notebook contains 3 main steps
Get data
Spatial Aggregation: get zonal statistics of complaint count by NTA, flood area by NTA
Statistical Analysis: correlation, regression between complaint counts and stormwater flood
import pandas as pd
import numpy as np
import geopandas as gpd
import matplotlib.pyplot as plt
import seaborn as sns
import glob
!pwd
%cd /Users/ho/Documents/GitHub/nyc-flood
!pwd
/Users/ho/Documents/GitHub/nyc-flood/src
/Users/ho/Documents/GitHub/nyc-flood
/Users/ho/Documents/GitHub/nyc-flood
Get Data#
Get Data – NYC 311 Complaints#
path = 'https://raw.githubusercontent.com/mebauer/nyc-311-street-flooding/main/data/street-flooding-complaints.csv'

df_311 = pd.read_csv(path, low_memory=False)

print(df_311.shape)
df_311.head()
(27902, 34)
| unique_key | created_date | agency | agency_name | complaint_type | descriptor | incident_zip | incident_address | street_name | cross_street_1 | ... | location | intersection_street_1 | intersection_street_2 | closed_date | resolution_description | resolution_action_updated_date | location_type | landmark | facility_type | due_date | |
|---|---|---|---|---|---|---|---|---|---|---|---|---|---|---|---|---|---|---|---|---|---|
| 0 | 48542220 | 2020-12-31T15:41:00.000 | DEP | Department of Environmental Protection | Sewer | Street Flooding (SJ) | 11420.0 | 117-17 135 STREET | 135 STREET | FOCH BLVD | ... | {'latitude': '40.67703755925495', 'longitude':... | NaN | NaN | 2021-01-01T00:20:00.000 | Please call 311 for further information. If yo... | 2021-01-01T00:20:00.000 | NaN | NaN | NaN | NaN |
| 1 | 48536430 | 2020-12-31T14:49:00.000 | DEP | Department of Environmental Protection | Sewer | Street Flooding (SJ) | 11357.0 | 20-24 150 STREET | 150 STREET | 20 AVE | ... | {'latitude': '40.78072630540092', 'longitude':... | NaN | NaN | 2021-01-04T10:15:00.000 | The Department of Environment Protection inspe... | 2021-01-04T10:15:00.000 | NaN | NaN | NaN | NaN |
| 2 | 48539361 | 2020-12-31T14:03:00.000 | DEP | Department of Environmental Protection | Sewer | Street Flooding (SJ) | 11228.0 | 7223 8 AVENUE | 8 AVENUE | 72 ST | ... | {'latitude': '40.62849640806448', 'longitude':... | NaN | NaN | 2021-01-02T11:25:00.000 | The Department of Environmental Protection has... | 2021-01-02T11:25:00.000 | NaN | NaN | NaN | NaN |
| 3 | 48543132 | 2020-12-31T13:48:00.000 | DEP | Department of Environmental Protection | Sewer | Street Flooding (SJ) | 10032.0 | NaN | NaN | NaN | ... | {'latitude': '40.841051689545516', 'longitude'... | RIVERSIDE DRIVE | WEST 165 STREET | 2020-12-31T14:50:00.000 | Please call 311 for further information. If yo... | 2020-12-31T14:50:00.000 | NaN | NaN | NaN | NaN |
| 4 | 48536441 | 2020-12-31T13:10:00.000 | DEP | Department of Environmental Protection | Sewer | Street Flooding (SJ) | 11234.0 | 3123 FILLMORE AVENUE | FILLMORE AVENUE | E 31 ST | ... | {'latitude': '40.609203447399906', 'longitude'... | NaN | NaN | 2021-01-03T10:45:00.000 | The Department of Environmental Protection ins... | 2021-01-03T10:45:00.000 | NaN | NaN | NaN | NaN |
5 rows × 34 columns
df_311[["latitude", "longitude"]].head()
| latitude | longitude | |
|---|---|---|
| 0 | 40.677038 | -73.804417 |
| 1 | 40.780726 | -73.814288 |
| 2 | 40.628496 | -74.016810 |
| 3 | 40.841052 | -73.944679 |
| 4 | 40.609203 | -73.936548 |
print(df_311.columns)
print(df_311.info())
Index(['unique_key', 'created_date', 'agency', 'agency_name', 'complaint_type',
       'descriptor', 'incident_zip', 'incident_address', 'street_name',
       'cross_street_1', 'cross_street_2', 'address_type', 'city', 'status',
       'community_board', 'bbl', 'borough', 'x_coordinate_state_plane',
       'y_coordinate_state_plane', 'open_data_channel_type',
       'park_facility_name', 'park_borough', 'latitude', 'longitude',
       'location', 'intersection_street_1', 'intersection_street_2',
       'closed_date', 'resolution_description',
       'resolution_action_updated_date', 'location_type', 'landmark',
       'facility_type', 'due_date'],
      dtype='object')
<class 'pandas.core.frame.DataFrame'>
RangeIndex: 27902 entries, 0 to 27901
Data columns (total 34 columns):
 #   Column                          Non-Null Count  Dtype
---  ------                          --------------  -----
 0   unique_key                      27902 non-null  int64
 1   created_date                    27902 non-null  object
 2   agency                          27902 non-null  object
 3   agency_name                     27902 non-null  object
 4   complaint_type                  27902 non-null  object
 5   descriptor                      27902 non-null  object
 6   incident_zip                    27045 non-null  float64
 7   incident_address                17865 non-null  object
 8   street_name                     17865 non-null  object
 9   cross_street_1                  24148 non-null  object
 10  cross_street_2                  24137 non-null  object
 11  address_type                    27896 non-null  object
 12  city                            27048 non-null  object
 13  status                          27902 non-null  object
 14  community_board                 27900 non-null  object
 15  bbl                             16159 non-null  float64
 16  borough                         27900 non-null  object
 17  x_coordinate_state_plane        26959 non-null  float64
 18  y_coordinate_state_plane        26959 non-null  float64
 19  open_data_channel_type          27902 non-null  object
 20  park_facility_name              27902 non-null  object
 21  park_borough                    27900 non-null  object
 22  latitude                        26959 non-null  float64
 23  longitude                       26959 non-null  float64
 24  location                        26959 non-null  object
 25  intersection_street_1           10091 non-null  object
 26  intersection_street_2           10091 non-null  object
 27  closed_date                     27900 non-null  object
 28  resolution_description          27896 non-null  object
 29  resolution_action_updated_date  27902 non-null  object
 30  location_type                   0 non-null      float64
 31  landmark                        0 non-null      float64
 32  facility_type                   0 non-null      float64
 33  due_date                        1 non-null      object
dtypes: float64(9), int64(1), object(24)
memory usage: 7.2+ MB
None
# to date_time
df_311['date_time'] = pd.to_datetime(df_311['created_date'], infer_datetime_format=True)
df_311 = df_311.sort_values(by='date_time').reset_index(drop=True)

df_311.date_time.head()
0   2010-01-02 08:26:00
1   2010-01-02 12:00:00
2   2010-01-02 17:45:00
3   2010-01-04 16:47:00
4   2010-01-05 10:37:00
Name: date_time, dtype: datetime64[ns]
# make spatial info

gdf_311 = gpd.GeoDataFrame(
    df_311,
    geometry=gpd.points_from_xy(
        df_311['x_coordinate_state_plane'],
        df_311['y_coordinate_state_plane']
    )
)

gdf_311 = gdf_311.set_crs(epsg=2263)
gdf_311.crs
<Derived Projected CRS: EPSG:2263>
Name: NAD83 / New York Long Island (ftUS)
Axis Info [cartesian]:
- X[east]: Easting (US survey foot)
- Y[north]: Northing (US survey foot)
Area of Use:
- name: United States (USA) - New York - counties of Bronx; Kings; Nassau; New York; Queens; Richmond; Suffolk.
- bounds: (-74.26, 40.47, -71.8, 41.3)
Coordinate Operation:
- name: SPCS83 New York Long Island zone (US Survey feet)
- method: Lambert Conic Conformal (2SP)
Datum: North American Datum 1983
- Ellipsoid: GRS 1980
- Prime Meridian: Greenwich
Get Data – NYC Stormwater Flood Map#
Quote from the Data’s Data Dictionary
The geodatabase contains a single feature class that shows two (2) flooding categories.
The “Nuisance Flooding (ponding depths greater or equal to 4 in. and less than 1 ft.)” and
“Deep and Contiguous Flooding (ponding depths 1 ft. and greater)”
categories were created using hydrologic and hydraulic computer models and represent flood risk due to extreme rainfall. Please refer to the New York City Stormwater Resiliency Plan for more information on the purpose of the study, how datasets were developed, applications for this data, and other details.
A coded value domain is used for the “Flooding_Category” field. See Column Info tab of the Data Dictionary for definition of each code.
The New York City Stormwater Flood Maps show areas of potential flooding of at least 0.25 contiguous acres with flood depths of 4 inches or more. This dataset contains some potential flooding areas less than 0.25 acres due to proximity and overlap with masking layers.
fn_sw = "/Users/ho/Documents/GitHub/nyc-flood/data/raw/NYC_Stormwater_Flood_Map_-_Moderate_Flood_with_Current_Sea_Levels/NYC Stormwater Flood Map - Moderate Flood with Current Sea Levels.gdb"
# fn_sw = "/Users/mac/Downloads/nyc-flood/data/raw/NYC_Stormwater_Flood_Map_-_Moderate_Flood_with_Current_Sea_Levels/NYC Stormwater Flood Map - Moderate Flood with Current Sea Levels.gdb"

gdf_sw = gpd.read_file(fn_sw)
print(gdf_sw.shape)
print(gdf_sw.head)
(2, 4)
<bound method NDFrame.head of    Flooding_Category  Shape_Length    Shape_Area  \
0                  1  6.456233e+06  7.937311e+07
1                  2  2.601608e+06  4.119771e+07

                                            geometry
0  MULTIPOLYGON Z (((917257.748 120888.120 0.000,...
1  MULTIPOLYGON Z (((917182.612 120877.544 0.000,...  >
print(gdf_sw.columns)
print(gdf_sw.info())
Index(['Flooding_Category', 'Shape_Length', 'Shape_Area', 'geometry'], dtype='object')
<class 'geopandas.geodataframe.GeoDataFrame'>
RangeIndex: 2 entries, 0 to 1
Data columns (total 4 columns):
 #   Column             Non-Null Count  Dtype
---  ------             --------------  -----
 0   Flooding_Category  2 non-null      int64
 1   Shape_Length       2 non-null      float64
 2   Shape_Area         2 non-null      float64
 3   geometry           2 non-null      geometry
dtypes: float64(2), geometry(1), int64(1)
memory usage: 192.0 bytes
None
Get Data – NYC NTAs#
fn_nta = glob.glob("/Users/ho/Documents/GitHub/nyc-flood/data/raw/nynta2020_23a/*.shp")[0]
# fn_nta = glob.glob("/Users/mac/Downloads/nyc-flood/data/raw/nynta2020_23a/*.shp")[0]

gdf_nta = gpd.read_file(fn_nta)

print(gdf_nta.shape)
print(gdf_nta.head)
(262, 12)
<bound method NDFrame.head of      BoroCode       BoroName CountyFIPS NTA2020                      NTAName  \
0           3       Brooklyn        047  BK0101                   Greenpoint
1           3       Brooklyn        047  BK0102                 Williamsburg
2           3       Brooklyn        047  BK0103           South Williamsburg
3           3       Brooklyn        047  BK0104            East Williamsburg
4           3       Brooklyn        047  BK0201             Brooklyn Heights
..        ...            ...        ...     ...                          ...
257         5  Staten Island        085  SI0391      Freshkills Park (South)
258         5  Staten Island        085  SI9561               Fort Wadsworth
259         5  Staten Island        085  SI9591  Hoffman & Swinburne Islands
260         5  Staten Island        085  SI9592                 Miller Field
261         5  Staten Island        085  SI9593             Great Kills Park

      NTAAbbrev NTAType CDTA2020  \
0         Grnpt       0     BK01
1      Wllmsbrg       0     BK01
2     SWllmsbrg       0     BK01
3     EWllmsbrg       0     BK01
4         BkHts       0     BK02
..          ...     ...      ...
257  FrshklPK_S       9     SI03
258   FtWdswrth       6     SI95
259    HffmnIsl       9     SI95
260     MllrFld       9     SI95
261    GrtKlsPk       9     SI95

                                              CDTAName    Shape_Leng  \
0       BK01 Williamsburg-Greenpoint (CD 1 Equivalent)  28914.172236
1       BK01 Williamsburg-Greenpoint (CD 1 Equivalent)  28158.316197
2       BK01 Williamsburg-Greenpoint (CD 1 Equivalent)  18250.280262
3       BK01 Williamsburg-Greenpoint (CD 1 Equivalent)  43184.772815
4    BK02 Downtown Brooklyn-Fort Greene (CD 2 Appro...  14312.504911
..                                                 ...           ...
257              SI03 South Shore (CD 3 Approximation)  33945.420291
258  SI95 Great Kills Park-Fort Wadsworth (JIA 95 A...  14816.104455
259  SI95 Great Kills Park-Fort Wadsworth (JIA 95 A...   4743.128127
260  SI95 Great Kills Park-Fort Wadsworth (JIA 95 A...  19197.200973
261  SI95 Great Kills Park-Fort Wadsworth (JIA 95 A...  41465.430028

       Shape_Area                                           geometry
0    3.532185e+07  POLYGON ((1003059.997 204572.025, 1002991.367 ...
1    2.886214e+07  POLYGON ((994849.011 203499.267, 994911.093 20...
2    1.520896e+07  POLYGON ((998047.210 196303.325, 998157.901 19...
3    5.226621e+07  POLYGON ((1005302.497 199455.730, 1005307.792 ...
4    9.982322e+06  POLYGON ((986367.735 190549.239, 985813.835 19...
..            ...                                                ...
257  4.775877e+07  POLYGON ((928531.433 150471.714, 929005.649 15...
258  9.864874e+06  POLYGON ((967656.829 155637.132, 967549.629 15...
259  6.357020e+05  MULTIPOLYGON (((970217.022 145643.332, 970227....
260  1.086680e+07  POLYGON ((960721.609 147492.642, 960370.525 14...
261  2.337791e+07  POLYGON ((952739.319 138974.819, 952732.507 13...

[262 rows x 12 columns]>
def get_name(x):
    return " ".join(x.split("(")[0].split(" ")[1:]).strip()

gdf_nta["CDTAName_2"] = gdf_nta["CDTAName"].apply(get_name)

gdf_nta["CDTAName_2"].head(10)
0          Williamsburg-Greenpoint
1          Williamsburg-Greenpoint
2          Williamsburg-Greenpoint
3          Williamsburg-Greenpoint
4    Downtown Brooklyn-Fort Greene
5    Downtown Brooklyn-Fort Greene
6    Downtown Brooklyn-Fort Greene
7    Downtown Brooklyn-Fort Greene
8    Downtown Brooklyn-Fort Greene
9               Bedford-Stuyvesant
Name: CDTAName_2, dtype: object
Visualize#
plt.style.use('ggplot')

fig, axs = plt.subplots(nrows=1, ncols=2, sharex=True, sharey=True, figsize=(25, 25))

gdf_nta.plot(ax=axs[0], color="lightgrey", edgecolor='white', markersize=1)
gdf_311.plot(ax=axs[0], markersize=1, color="blue", alpha=0.5)
gdf_nta.boundary.plot(ax=axs[0], color="white", markersize=0.01)

gdf_nta.plot(ax=axs[1], color="lightgrey", edgecolor='white', markersize=1)
gdf_sw[gdf_sw['Flooding_Category']==1].plot(color="blue", ax=axs[1], legend=True, edgecolor='None')
gdf_sw[gdf_sw['Flooding_Category']==2].plot(color="red", ax=axs[1], legend=True, edgecolor='None')


axs[0].set_title("311 Street Flooding Complaints")
axs[1].set_title("Stormwater Flood Map - Moderate Flood with Current Sea Levels")
axs[0].set_axis_off()
axs[1].set_axis_off()
plt.show()
Spatial Aggregation#
# same coordinate system
print(gdf_311.crs)
print(gdf_sw.crs)
print(gdf_nta.crs)

# unit for epsg 2263 is ft
EPSG:2263
EPSG:2263
EPSG:2263
# gdf_sw['Flooding_Category'].head()
# gdf_sw.info()
gdf_nta.info()
gdf_nta.head()
gdf_nta[["NTA2020", "NTAName", "NTAAbbrev", "NTAType"]].head()
<class 'geopandas.geodataframe.GeoDataFrame'>
RangeIndex: 262 entries, 0 to 261
Data columns (total 13 columns):
 #   Column      Non-Null Count  Dtype
---  ------      --------------  -----
 0   BoroCode    262 non-null    int64
 1   BoroName    262 non-null    object
 2   CountyFIPS  262 non-null    object
 3   NTA2020     262 non-null    object
 4   NTAName     262 non-null    object
 5   NTAAbbrev   262 non-null    object
 6   NTAType     262 non-null    object
 7   CDTA2020    262 non-null    object
 8   CDTAName    262 non-null    object
 9   Shape_Leng  262 non-null    float64
 10  Shape_Area  262 non-null    float64
 11  geometry    262 non-null    geometry
 12  CDTAName_2  262 non-null    object
dtypes: float64(2), geometry(1), int64(1), object(9)
memory usage: 26.7+ KB
| NTA2020 | NTAName | NTAAbbrev | NTAType | |
|---|---|---|---|---|
| 0 | BK0101 | Greenpoint | Grnpt | 0 |
| 1 | BK0102 | Williamsburg | Wllmsbrg | 0 |
| 2 | BK0103 | South Williamsburg | SWllmsbrg | 0 |
| 3 | BK0104 | East Williamsburg | EWllmsbrg | 0 |
| 4 | BK0201 | Brooklyn Heights | BkHts | 0 |
1. Zonal Statistics - get area of storm water floods by nta#
# flood cat 1

gdf_sw1 = gdf_sw[gdf_sw['Flooding_Category']==1].copy()

# Perform a spatial overlay between the two datasets
col_area = "area_1"
intersect = gpd.overlay(gdf_nta, gdf_sw1, how='intersection') #Intersect
intersect[col_area] = intersect.geometry.area #Calculate area column
interarea = intersect.groupby('NTA2020')[col_area].sum() #Sum per id_col

interarea_sw1 = interarea.copy()
interarea_sw1.head()
NTA2020
BK0101    467067.461780
BK0102    530276.021515
BK0103    640600.725771
BK0104    537490.748283
BK0202     39532.737758
Name: area_1, dtype: float64
# flood cat 2

gdf_sw2 = gdf_sw[gdf_sw['Flooding_Category']==2].copy()

# Perform a spatial overlay between the two datasets
col_area = "area_2"
intersect = gpd.overlay(gdf_nta, gdf_sw2, how='intersection') #Intersect
intersect[col_area] = intersect.geometry.area #Calculate area column
interarea = intersect.groupby('NTA2020')[col_area].sum() #Sum per id_col

interarea_sw2 = interarea.copy()
interarea_sw2.head()
NTA2020
BK0101    205400.901252
BK0102    317958.625597
BK0103    656351.894516
BK0104     92390.450821
BK0202      9288.103214
Name: area_2, dtype: float64
# Merge the 2 type of floods to NTA and calculate sum (area_all)

gdf_sw_nta = gdf_nta.merge(right=interarea_sw1, how='left', left_on='NTA2020', right_index=True)
gdf_sw_nta = gdf_sw_nta.merge(right=interarea_sw2, how='left', left_on='NTA2020', right_index=True)
gdf_sw_nta["area_1"] = gdf_sw_nta["area_1"].fillna(0)
gdf_sw_nta["area_2"] = gdf_sw_nta["area_2"].fillna(0)

gdf_sw_nta["area_all"] = gdf_sw_nta["area_1"] + gdf_sw_nta["area_2"]
gdf_sw_nta["area_all"] = gdf_sw_nta["area_all"].fillna(0)

gdf_sw_nta.head()
| BoroCode | BoroName | CountyFIPS | NTA2020 | NTAName | NTAAbbrev | NTAType | CDTA2020 | CDTAName | Shape_Leng | Shape_Area | geometry | CDTAName_2 | area_1 | area_2 | area_all | |
|---|---|---|---|---|---|---|---|---|---|---|---|---|---|---|---|---|
| 0 | 3 | Brooklyn | 047 | BK0101 | Greenpoint | Grnpt | 0 | BK01 | BK01 Williamsburg-Greenpoint (CD 1 Equivalent) | 28914.172236 | 3.532185e+07 | POLYGON ((1003059.997 204572.025, 1002991.367 ... | Williamsburg-Greenpoint | 467067.461780 | 205400.901252 | 6.724684e+05 |
| 1 | 3 | Brooklyn | 047 | BK0102 | Williamsburg | Wllmsbrg | 0 | BK01 | BK01 Williamsburg-Greenpoint (CD 1 Equivalent) | 28158.316197 | 2.886214e+07 | POLYGON ((994849.011 203499.267, 994911.093 20... | Williamsburg-Greenpoint | 530276.021515 | 317958.625597 | 8.482346e+05 |
| 2 | 3 | Brooklyn | 047 | BK0103 | South Williamsburg | SWllmsbrg | 0 | BK01 | BK01 Williamsburg-Greenpoint (CD 1 Equivalent) | 18250.280262 | 1.520896e+07 | POLYGON ((998047.210 196303.325, 998157.901 19... | Williamsburg-Greenpoint | 640600.725771 | 656351.894516 | 1.296953e+06 |
| 3 | 3 | Brooklyn | 047 | BK0104 | East Williamsburg | EWllmsbrg | 0 | BK01 | BK01 Williamsburg-Greenpoint (CD 1 Equivalent) | 43184.772815 | 5.226621e+07 | POLYGON ((1005302.497 199455.730, 1005307.792 ... | Williamsburg-Greenpoint | 537490.748283 | 92390.450821 | 6.298812e+05 |
| 4 | 3 | Brooklyn | 047 | BK0201 | Brooklyn Heights | BkHts | 0 | BK02 | BK02 Downtown Brooklyn-Fort Greene (CD 2 Appro... | 14312.504911 | 9.982322e+06 | POLYGON ((986367.735 190549.239, 985813.835 19... | Downtown Brooklyn-Fort Greene | 0.000000 | 0.000000 | 0.000000e+00 |
2. Zonal Statistics - get counts of 311 flood complaints by nta#
# gdf_311

joined_data = gpd.sjoin(gdf_311, gdf_nta, how='right', op='within')
count_pt = joined_data.groupby('NTA2020').size().reset_index(name='count_311')
count_pt.head()
/Users/ho/.local/lib/python3.11/site-packages/IPython/core/interactiveshell.py:3400: FutureWarning: The `op` parameter is deprecated and will be removed in a future release. Please use the `predicate` parameter instead.
  if await self.run_code(code, result, async_=asy):
| NTA2020 | count_311 | |
|---|---|---|
| 0 | BK0101 | 109 |
| 1 | BK0102 | 79 |
| 2 | BK0103 | 136 |
| 3 | BK0104 | 82 |
| 4 | BK0201 | 24 |
# gdf_sw_nta.drop(columns=["count_311_x", "count_311_y", "count_311"], inplace=True)
gdf_sw_nta.head()
| BoroCode | BoroName | CountyFIPS | NTA2020 | NTAName | NTAAbbrev | NTAType | CDTA2020 | CDTAName | Shape_Leng | Shape_Area | geometry | CDTAName_2 | area_1 | area_2 | area_all | |
|---|---|---|---|---|---|---|---|---|---|---|---|---|---|---|---|---|
| 0 | 3 | Brooklyn | 047 | BK0101 | Greenpoint | Grnpt | 0 | BK01 | BK01 Williamsburg-Greenpoint (CD 1 Equivalent) | 28914.172236 | 3.532185e+07 | POLYGON ((1003059.997 204572.025, 1002991.367 ... | Williamsburg-Greenpoint | 467067.461780 | 205400.901252 | 6.724684e+05 |
| 1 | 3 | Brooklyn | 047 | BK0102 | Williamsburg | Wllmsbrg | 0 | BK01 | BK01 Williamsburg-Greenpoint (CD 1 Equivalent) | 28158.316197 | 2.886214e+07 | POLYGON ((994849.011 203499.267, 994911.093 20... | Williamsburg-Greenpoint | 530276.021515 | 317958.625597 | 8.482346e+05 |
| 2 | 3 | Brooklyn | 047 | BK0103 | South Williamsburg | SWllmsbrg | 0 | BK01 | BK01 Williamsburg-Greenpoint (CD 1 Equivalent) | 18250.280262 | 1.520896e+07 | POLYGON ((998047.210 196303.325, 998157.901 19... | Williamsburg-Greenpoint | 640600.725771 | 656351.894516 | 1.296953e+06 |
| 3 | 3 | Brooklyn | 047 | BK0104 | East Williamsburg | EWllmsbrg | 0 | BK01 | BK01 Williamsburg-Greenpoint (CD 1 Equivalent) | 43184.772815 | 5.226621e+07 | POLYGON ((1005302.497 199455.730, 1005307.792 ... | Williamsburg-Greenpoint | 537490.748283 | 92390.450821 | 6.298812e+05 |
| 4 | 3 | Brooklyn | 047 | BK0201 | Brooklyn Heights | BkHts | 0 | BK02 | BK02 Downtown Brooklyn-Fort Greene (CD 2 Appro... | 14312.504911 | 9.982322e+06 | POLYGON ((986367.735 190549.239, 985813.835 19... | Downtown Brooklyn-Fort Greene | 0.000000 | 0.000000 | 0.000000e+00 |
# join count_311 with NTA and zonal stats for stormwater

try:
    # drop column if already exist
    gdf_sw_nta.drop(columns=["count_311"], inplace=True)
except:
    pass

gdf_sw_nta = gdf_sw_nta.merge(right=count_pt, how='left', on='NTA2020')
gdf_sw_nta["count_311"] = gdf_sw_nta["count_311"].fillna(0)

gdf_sw_nta.head()
| BoroCode | BoroName | CountyFIPS | NTA2020 | NTAName | NTAAbbrev | NTAType | CDTA2020 | CDTAName | Shape_Leng | Shape_Area | geometry | CDTAName_2 | area_1 | area_2 | area_all | count_311 | |
|---|---|---|---|---|---|---|---|---|---|---|---|---|---|---|---|---|---|
| 0 | 3 | Brooklyn | 047 | BK0101 | Greenpoint | Grnpt | 0 | BK01 | BK01 Williamsburg-Greenpoint (CD 1 Equivalent) | 28914.172236 | 3.532185e+07 | POLYGON ((1003059.997 204572.025, 1002991.367 ... | Williamsburg-Greenpoint | 467067.461780 | 205400.901252 | 6.724684e+05 | 109 |
| 1 | 3 | Brooklyn | 047 | BK0102 | Williamsburg | Wllmsbrg | 0 | BK01 | BK01 Williamsburg-Greenpoint (CD 1 Equivalent) | 28158.316197 | 2.886214e+07 | POLYGON ((994849.011 203499.267, 994911.093 20... | Williamsburg-Greenpoint | 530276.021515 | 317958.625597 | 8.482346e+05 | 79 |
| 2 | 3 | Brooklyn | 047 | BK0103 | South Williamsburg | SWllmsbrg | 0 | BK01 | BK01 Williamsburg-Greenpoint (CD 1 Equivalent) | 18250.280262 | 1.520896e+07 | POLYGON ((998047.210 196303.325, 998157.901 19... | Williamsburg-Greenpoint | 640600.725771 | 656351.894516 | 1.296953e+06 | 136 |
| 3 | 3 | Brooklyn | 047 | BK0104 | East Williamsburg | EWllmsbrg | 0 | BK01 | BK01 Williamsburg-Greenpoint (CD 1 Equivalent) | 43184.772815 | 5.226621e+07 | POLYGON ((1005302.497 199455.730, 1005307.792 ... | Williamsburg-Greenpoint | 537490.748283 | 92390.450821 | 6.298812e+05 | 82 |
| 4 | 3 | Brooklyn | 047 | BK0201 | Brooklyn Heights | BkHts | 0 | BK02 | BK02 Downtown Brooklyn-Fort Greene (CD 2 Appro... | 14312.504911 | 9.982322e+06 | POLYGON ((986367.735 190549.239, 985813.835 19... | Downtown Brooklyn-Fort Greene | 0.000000 | 0.000000 | 0.000000e+00 | 24 |
gdf_sw_nta.to_file("/Users/ho/Documents/GitHub/nyc-flood/data/processed/nta_flood_vs_311.shp")
3. Visualize#
# create a choropleth map of 311 complaints counts and storm water flood area by NTAs

plt.style.use('ggplot')
fig, axs = plt.subplots(nrows=1, ncols=2, figsize=(20, 10))

missing_kwds={"color": "lightgrey","edgecolor": "lightgrey","label": "Missing values"}
gdf_sw_nta.plot(
    ax=axs[0], column='count_311', cmap='OrRd', edgecolor="none", linewidth=1, legend=True,
    legend_kwds = {'label': "Counts of 311 Complaints"}, missing_kwds=missing_kwds)
gdf_nta.boundary.plot(ax=axs[0], color="grey", markersize=0.0001, alpha=0.5)

axs[0].set_title("Counts of 311 Complaints by NTA")
axs[0].set_axis_off()


missing_kwds={"color": "lightgrey","edgecolor": "lightgrey","label": "Missing values"}
gdf_sw_nta.plot(
    ax=axs[1], column='area_all', cmap='Blues', edgecolor="none", linewidth=1, legend=True,
    legend_kwds = {'label': "Area of Storm Water Flooding (ft2)"}, missing_kwds=missing_kwds)
gdf_nta.boundary.plot(ax=axs[1], color="grey", markersize=0.0001, alpha=0.5)

axs[1].set_title("Area of Storm Water Flooding by NTA (ft2)")
axs[1].set_axis_off()

plt.tight_layout()
plt.show()
Statistical Analysis#
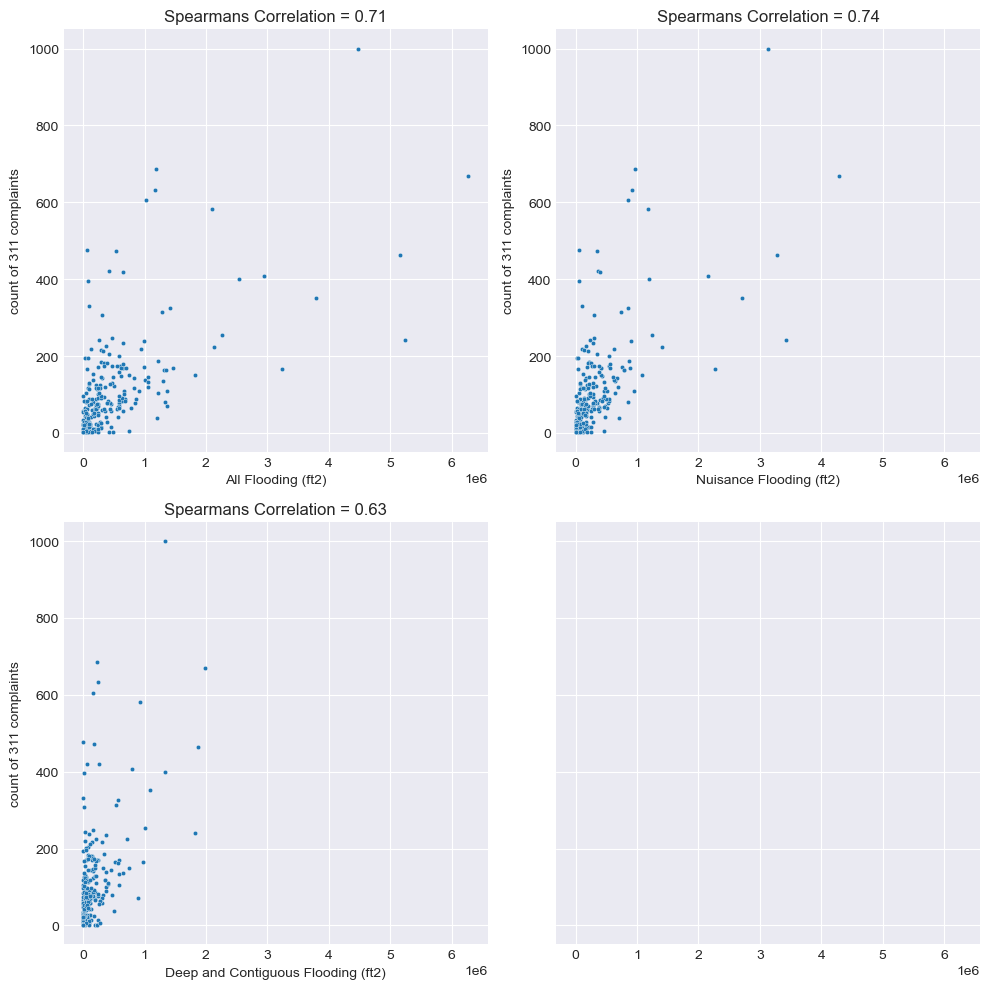
Assess relationship between area of floods and counts of 311 complaints
# fn_sw_nta = glob.glob("/Users/mac/Downloads/nyc-flood/data/processed/*.shp")[0]
fn_sw_nta = "/Users/ho/Documents/GitHub/nyc-flood/data/processed/nta_flood_vs_311.shp"

gdf_sw_nta = gpd.read_file(fn_sw_nta)

print(gdf_sw_nta.shape)
print(gdf_sw_nta.columns)
(262, 17)
Index(['BoroCode', 'BoroName', 'CountyFIPS', 'NTA2020', 'NTAName', 'NTAAbbrev',
       'NTAType', 'CDTA2020', 'CDTAName', 'Shape_Leng', 'Shape_Area',
       'CDTAName_2', 'area_1', 'area_2', 'area_all', 'count_311', 'geometry'],
      dtype='object')
1. Correlation#
# correlation
# calculate the spearmans's correlation between two variables
from scipy.stats import spearmanr
print("Spearmans correlation")

spm_corrs = []

corr, _ = spearmanr(gdf_sw_nta['area_all'], gdf_sw_nta['count_311'])
spm_corrs += [corr]
print(f"-- All Flooding vs Counts of 311 Complaints: {np.round(corr, 2)}")

corr, _ = spearmanr(gdf_sw_nta['area_1'], gdf_sw_nta['count_311'])
print(f"-- Nuisance Flooding (1 ft > depth >= 4 inch) vs Counts of 311 Complaints: {np.round(corr, 2)}")
spm_corrs += [corr]

corr, _ = spearmanr(gdf_sw_nta['area_2'], gdf_sw_nta['count_311'])
print(f"-- Deep and Contiguous Flooding (depth >= 1 ft) vs Counts of 311 Complaints: {np.round(corr, 2)}")
spm_corrs += [corr]
Spearmans correlation
-- All Flooding vs Counts of 311 Complaints: 0.71
-- Nuisance Flooding (1 ft > depth >= 4 inch) vs Counts of 311 Complaints: 0.74
-- Deep and Contiguous Flooding (depth >= 1 ft) vs Counts of 311 Complaints: 0.63
fds = ['area_all', 'area_1', 'area_2']
floodtypes = ['All Flooding (ft2)', 'Nuisance Flooding (ft2)', 'Deep and Contiguous Flooding (ft2)']

# plot
plt.clf()
plt.style.use("seaborn-darkgrid")
nrows = 2
ncols = 2
f, axs = plt.subplots(nrows=nrows, ncols=ncols,
                      figsize=(10, 10), sharex=True, sharey=True)
n = 0
for irow in range(0,nrows):
    for icol in range(0,ncols):

        try:
            fd, spm_corr, floodtype = list(zip(fds, spm_corrs, floodtypes))[n]
        except:
            continue
        n += 1

        # scatterplot / lineplot
        scatter = sns.scatterplot(
            data=gdf_sw_nta, y="count_311", x=f"{fd}",
            ax=axs[irow, icol], s=10) #, legend=False)

        # axs[irow, icol].plot(np.array(gdf_sw_nta["count_311"]),
        #                     np.array(gdf_sw_nta[f"{fd}"]), color='r')

        scatter.set(title=f"Spearmans Correlation = {round(spm_corr, 2)}")
        scatter.set_xlabel(f"{floodtype}")
        scatter.set_ylabel("Count of 311 Complaints")

        axs[irow, icol].xaxis.get_label().set_visible(True)
        axs[irow, icol].yaxis.get_label().set_visible(True)

        axs[irow, icol].xaxis.set_tick_params(labelbottom=True)
        axs[irow, icol].yaxis.set_tick_params(labelleft=True)


plt.tight_layout()
plt.show()
/var/folders/ft/drjxcwpd0cb31nn1whf1scxh0000gn/T/ipykernel_20799/1769750736.py:6: MatplotlibDeprecationWarning: The seaborn styles shipped by Matplotlib are deprecated since 3.6, as they no longer correspond to the styles shipped by seaborn. However, they will remain available as 'seaborn-v0_8-<style>'. Alternatively, directly use the seaborn API instead.
  plt.style.use("seaborn-darkgrid")
<Figure size 640x480 with 0 Axes>
2. Did people complain equally to minor flooding and severe flooding?#
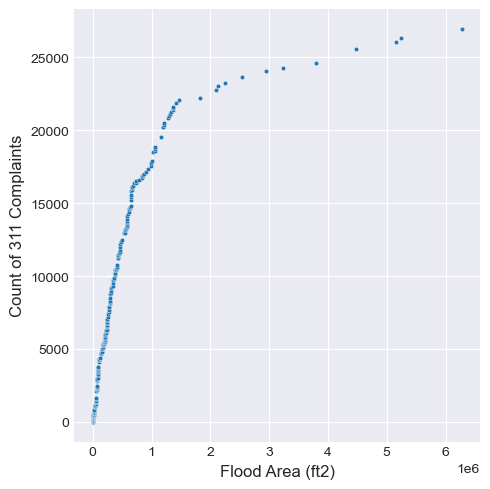
As the area of storm water flooding increase, the increase of the counts of 311 complaints slow down. (people who will complain alreay complain)
f, axs = plt.subplots(nrows=1, ncols=1,
                      figsize=(5, 5), sharex=True, sharey=False)

gdf_sw_nta = gdf_sw_nta.sort_values(by='area_all')
gdf_sw_nta['count_311_cumsum'] = gdf_sw_nta.count_311.cumsum()

scatter = sns.scatterplot(
    data=gdf_sw_nta, x='area_all',
    y='count_311_cumsum',
    ax=axs, s=10, c="tab:blue")

scatter.set_xlabel(f"Flood Area (ft2)")
scatter.set_ylabel("Count of 311 Complaints")
plt.tight_layout()
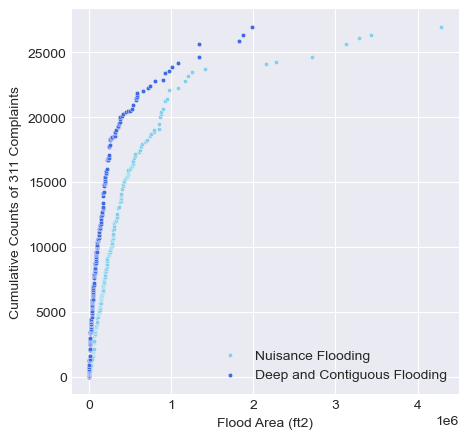
People complained more when it’s deep and contiguous flooding.
f, axs = plt.subplots(nrows=1, ncols=1,
                      figsize=(5, 5), sharex=True, sharey=False)

gdf_sw_nta = gdf_sw_nta.sort_values(by='area_1')
gdf_sw_nta['count_311_cumsum'] = gdf_sw_nta.count_311.cumsum()

scatter = sns.scatterplot(
    data=gdf_sw_nta, x='area_1',
    y='count_311_cumsum',
    ax=axs, s=10, color="skyblue", legend=True)

gdf_sw_nta = gdf_sw_nta.sort_values(by='area_2')
gdf_sw_nta['count_311_cumsum'] = gdf_sw_nta.count_311.cumsum()

scatter = sns.scatterplot(
    data=gdf_sw_nta, x='area_2',
    y='count_311_cumsum',
    ax=axs, s=10, color='royalblue', legend=True)


plt.legend(['Nuisance Flooding', 'Deep and Contiguous Flooding'], loc="lower right")
axs.set_xlabel("Flood Area (ft2)")
axs.set_ylabel("Cumulative Counts of 311 Complaints")
Text(0, 0.5, 'Cumulative Counts of 311 Complaints')
3. Regression#
The 311 counts are discrete count numbers and are usually modeled by Poisson distribution or negative binomial distribution. Here we use negative binomial distribution.
The result shows that when log(storm water flood area) increase by 1 unit, the counts of 311 complains increase by 10% in each neighborhood.
import statsmodels.api as sm

gdf_sw_nta['log_area_1'] = np.log(gdf_sw_nta['area_1']+.1)
gdf_sw_nta['log_area_2'] = np.log(gdf_sw_nta['area_2']+.1)
gdf_sw_nta['log_Shape_Area'] = np.log(gdf_sw_nta['Shape_Area']+.1)

y = gdf_sw_nta[['count_311']]
X = gdf_sw_nta[['log_area_all', 'log_Shape_Area']]
X = sm.add_constant(X)

glm_model = sm.GLM(y, X, family=sm.genmod.families.family.NegativeBinomial())
glm_result = glm_model.fit()


print(glm_result.aic)
print(glm_result.bic)

glm_result.summary()

# exp(0.0992)-1 = 0.104
## log(area_all) increae by 1 unit, count_311 increase by 10%
2721.0004753624216
-1184.041098602999
/Users/ho/opt/anaconda3/envs/nyc-flood/lib/python3.11/site-packages/statsmodels/genmod/generalized_linear_model.py:1799: FutureWarning: The bic value is computed using the deviance formula. After 0.13 this will change to the log-likelihood based formula. This change has no impact on the relative rank of models compared using BIC. You can directly access the log-likelihood version using the `bic_llf` attribute. You can suppress this message by calling statsmodels.genmod.generalized_linear_model.SET_USE_BIC_LLF with True to get the LLF-based version now or False to retainthe deviance version.
  warnings.warn(
| Dep. Variable: | count_311 | No. Observations: | 262 |
|---|---|---|---|
| Model: | GLM | Df Residuals: | 259 |
| Model Family: | NegativeBinomial | Df Model: | 2 |
| Link Function: | Log | Scale: | 1.0000 |
| Method: | IRLS | Log-Likelihood: | -1357.5 |
| Date: | Fri, 17 Mar 2023 | Deviance: | 258.16 |
| Time: | 22:55:27 | Pearson chi2: | 315. |
| No. Iterations: | 8 | Pseudo R-squ. (CS): | 0.5998 |
| Covariance Type: | nonrobust |
| coef | std err | z | P>|z| | [0.025 | 0.975] | |
|---|---|---|---|---|---|---|
| const | -11.6930 | 1.403 | -8.332 | 0.000 | -14.443 | -8.943 |
| log_area_all | 0.0992 | 0.015 | 6.743 | 0.000 | 0.070 | 0.128 |
| log_Shape_Area | 0.8739 | 0.086 | 10.111 | 0.000 | 0.705 | 1.043 |
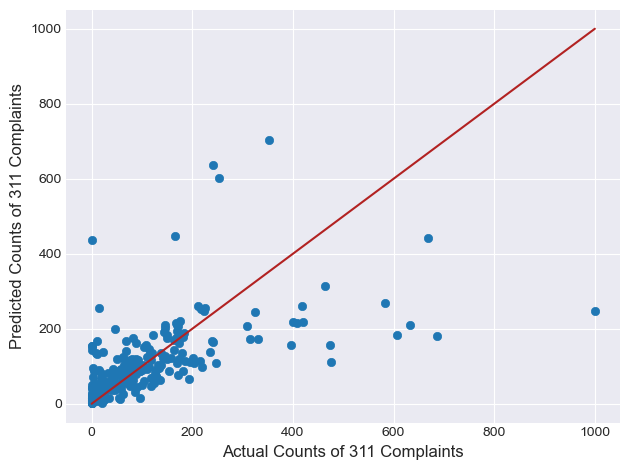
# if the model fit well, the points should fall along the red line.
# plt.style.use("seaborn-darkgrid")
plt.scatter(x=y, y=glm_result.fittedvalues, color='tab:blue')
plt.plot([0, 1000], [0, 1000], c='firebrick')
plt.xlabel('Actual Counts of 311 Complaints')
plt.ylabel('Predicted Counts of 311 Complaints')
plt.tight_layout()
plt.scatter(glm_result.fittedvalues, glm_result.resid_pearson)
plt.xlabel('Predicted Counts of 311 Complaints')
plt.ylabel('Residuals')
plt.tight_layout()
Next Step!#
Are the coefficients vary spatially?
Are there other variables good predictors of the 311 flood complaints? eg. population, income level
