Clean Data#
Import Libraries#
Standard Libraries#
import json
For more on working with json in Python, see [Lofaro, 2018].
External Libraries#
import geopandas as gpd
Define Variables#
nyc_street_flooding_input = 'data/street-flooding/street-flood-complaints_rows-all.geojson'
nyc_street_flooding_output = 'data/street-flooding/clean_street-flood-complaints_rows-all.geojson'
data_stats_json_output = 'data/data-stats.json'
Get Original Data#
street_flooding_gdf = gpd.read_file(nyc_street_flooding_input)
Before Count#
street_flooding_complaints_before_count = len(street_flooding_gdf)
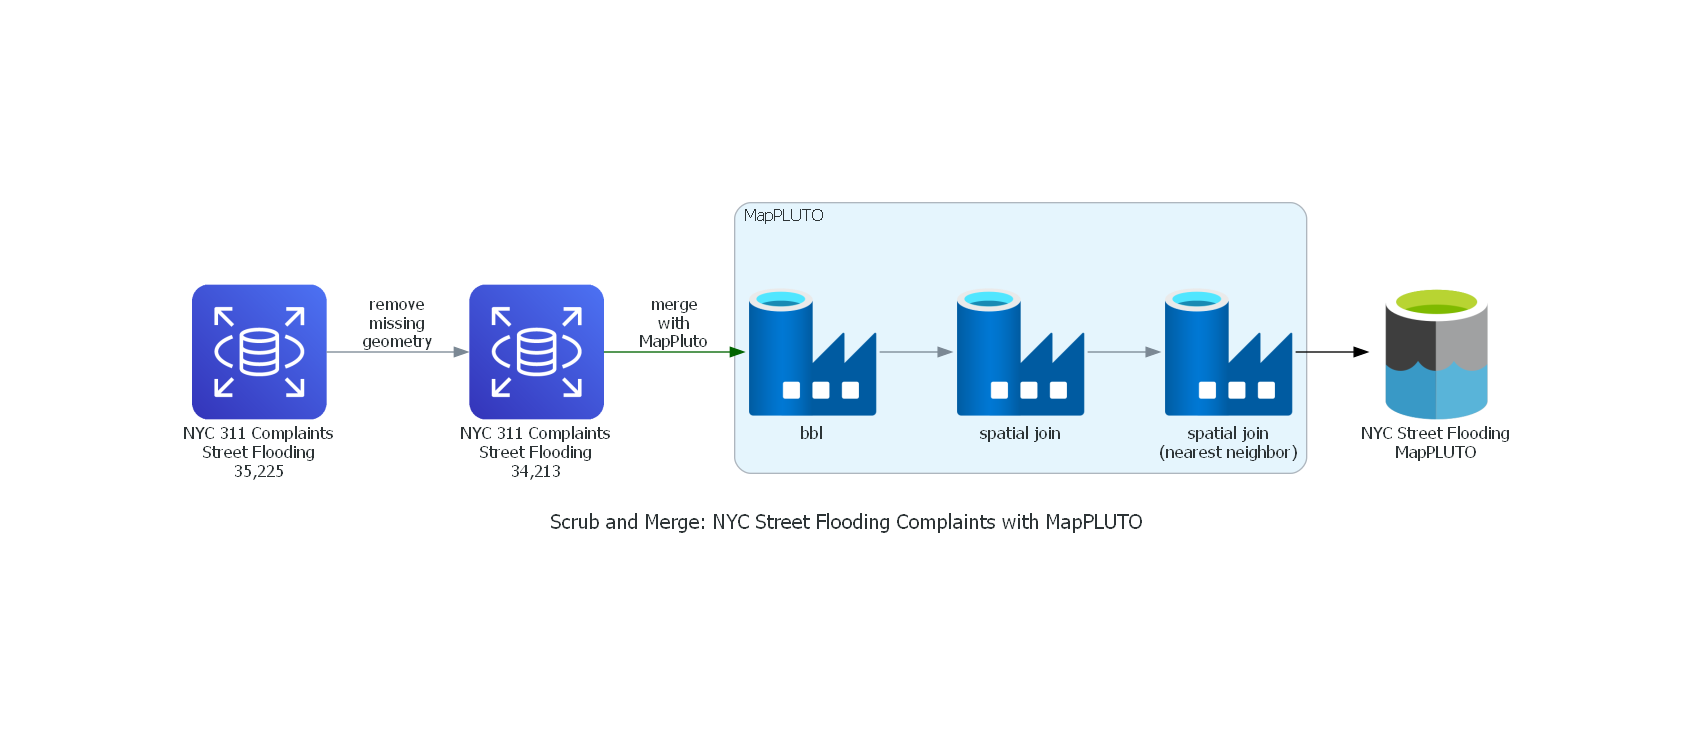
print(f'There were {street_flooding_complaints_before_count:,} street flooding complaints from 2010 to the present.')
There were 35,225 street flooding complaints from 2010 to the present.
Set unique_key as Index#
street_flooding_gdf.set_index('unique_key', inplace=True)
Remove Rows With Missing geometry#
street_flooding_gdf.dropna(subset = ['geometry'], inplace = True)
After Count#
street_flooding_complaints_after_count = len(street_flooding_gdf)
print(f'There were {street_flooding_complaints_after_count:,} street flooding complaints after rows with missing geometry have been removed.')
There were 34,213 street flooding complaints after rows with missing geometry have been removed.
Preview Street Flooding Data#
street_flooding_gdf[['created_date', 'borough', 'bbl', 'geometry']].head(10)
| created_date | borough | bbl | geometry | |
|---|---|---|---|---|
| unique_key | ||||
| 15639934 | 2010-01-02 08:26:00 | BROOKLYN | 3089000064 | POINT (-73.92178 40.58778) |
| 15640572 | 2010-01-02 12:00:00 | STATEN ISLAND | NaN | POINT (-74.14329 40.63866) |
| 15640664 | 2010-01-02 17:45:00 | QUEENS | 4120050012 | POINT (-73.79530 40.68140) |
| 15655327 | 2010-01-04 16:47:00 | QUEENS | 4106210008 | POINT (-73.73843 40.72006) |
| 15668560 | 2010-01-05 10:37:00 | BROOKLYN | 3086550021 | POINT (-73.90969 40.61250) |
| 15674300 | 2010-01-06 19:26:00 | BROOKLYN | 3029270015 | POINT (-73.93297 40.71584) |
| 15674896 | 2010-01-06 08:24:00 | QUEENS | 4119960122 | POINT (-73.80255 40.67925) |
| 15674924 | 2010-01-06 09:17:00 | STATEN ISLAND | 5040740044 | POINT (-74.10646 40.55866) |
| 15675505 | 2010-01-06 06:00:00 | QUEENS | 4030030044 | POINT (-73.87694 40.71804) |
| 15683503 | 2010-01-07 10:16:00 | STATEN ISLAND | 5014850078 | POINT (-74.14943 40.61979) |
street_flooding_gdf[['created_date', 'borough', 'bbl', 'geometry']].tail(10)
| created_date | borough | bbl | geometry | |
|---|---|---|---|---|
| unique_key | ||||
| 57197757 | 2023-03-31 14:50:00 | QUEENS | 4035540010 | POINT (-73.90314 40.69508) |
| 57198900 | 2023-03-31 15:56:00 | BROOKLYN | NaN | POINT (-73.97547 40.67447) |
| 57200823 | 2023-04-01 17:05:00 | BROOKLYN | 3050530018 | POINT (-73.96291 40.65447) |
| 57200825 | 2023-04-01 19:56:00 | STATEN ISLAND | 5035730072 | POINT (-74.09985 40.58014) |
| 57201654 | 2023-04-01 12:35:00 | QUEENS | 4062770002 | POINT (-73.77331 40.76058) |
| 57202517 | 2023-04-01 21:32:00 | QUEENS | 4010500002 | POINT (-73.89320 40.76207) |
| 57204262 | 2023-04-01 23:17:00 | BROOKLYN | 3083070080 | POINT (-73.88413 40.63804) |
| 57204275 | 2023-04-01 16:14:00 | BROOKLYN | 3077180057 | POINT (-73.93635 40.61422) |
| 57204312 | 2023-04-01 14:32:00 | BRONX | NaN | POINT (-73.90305 40.84063) |
| 57204361 | 2023-04-01 14:17:00 | BRONX | NaN | POINT (-73.88099 40.87091) |
Save Datasets#
Save Street Flooding GeoDataFrame#
street_flooding_gdf.to_file(nyc_street_flooding_output, driver='GeoJSON')
Save Counts to JSON file#
gdf_counts = {
    "street_flood_orig": street_flooding_complaints_before_count,
    "street_flood_clean": street_flooding_complaints_after_count
}
with open(data_stats_json_output, 'w') as write_json:
    json.dump(gdf_counts, write_json, indent = 4)